In today’s fast-paced digital landscape, data is at the heart of business decision-making. However, working with raw data, especially in spreadsheets, can be a daunting task without the right tools. This is where ChatGPT’s Advanced Data Analysis (ADA) capabilities come in, transforming complex datasets into actionable insights and compelling visualizations.
In this guide, we’ll explore how to unlock the power of ChatGPT for data analysis, the key features available, and how to create stunning visualizations. Let’s dive in!
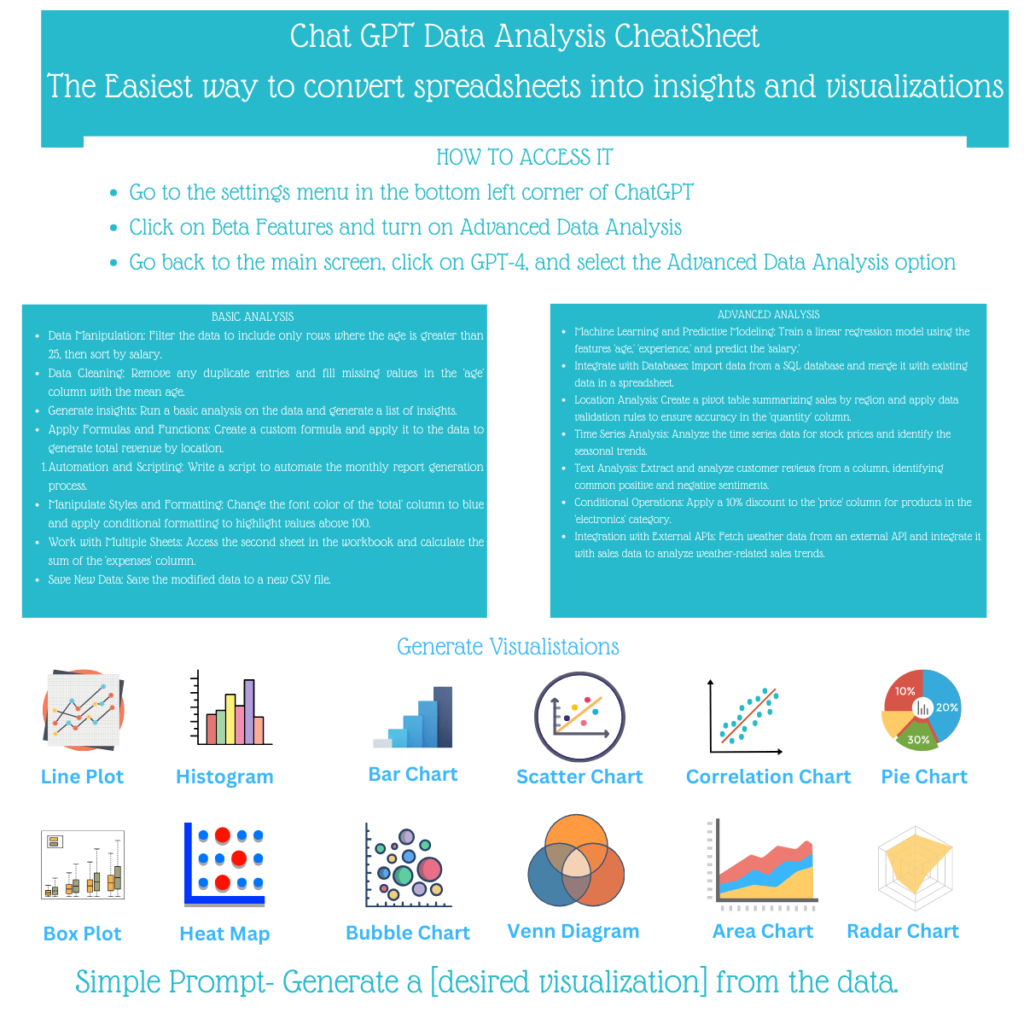
ChatGPT’s Advanced Data Analysis tool provides an easy-to-use interface that eliminates the need for specialized coding knowledge. With its robust features, you can clean data, perform in-depth analysis, and generate professional-quality visualizations with simple prompts. Whether you are a data professional or a beginner, ChatGPT bridges the gap between raw data and meaningful outcomes.
Step 1: Enable the Advanced Data Analysis Tool
To access this feature, follow these simple steps:
Once you’ve enabled the feature, you’re ready to explore its full potential.
The tool comes equipped with several features to help streamline your analysis process:
Data Manipulation
Data Cleaning
Eliminate duplicate entries.
Generate Insights
Custom Formulas and Automation
Style and Formatting
Working with Multiple Sheets
Save and Export
For users looking to go beyond basic operations, ChatGPT offers advanced functionality:
Machine Learning and Predictive Modeling
Database Integration
Location Analysis
Time-Series Analysis
Text Analysis
Conditional Operations
API Integration
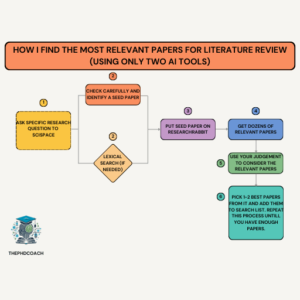
Generative AI is a rapidly evolving field, and staying updated with the latest literature is key. Below are top resources to help you dive into AI research:
Visualization is a vital aspect of data analysis, helping users interpret complex datasets at a glance. With ChatGPT, generating visualizations is as simple as typing a prompt. Below are the types of visualizations you can create:
Ideal for tracking trends over time, such as monthly sales or stock prices.
Useful for displaying frequency distributions, such as age groups or income brackets.
Effective for comparing categorical data, like revenue by product type.
Showcase relationships between two variables, such as experience versus salary.
Discover correlations between variables, helping to identify dependencies.
Visualize proportions within a dataset, such as market share by region.
Highlight the distribution and variability of data, such as salary ranges.
Present data intensity and trends using a color-coded grid.
Add a third dimension to your scatter plots, using bubble size to represent an additional metric.
Show overlapping relationships between categories, such as customer segmentation.
Track cumulative values over time, making it perfect for visualizing growth.
Illustrate multiple variables in a circular format for comparative analysis.
To create visualizations, simply provide a prompt like:
“Generate a [visualization type] from my data”
For example:
“Create a scatter chart comparing experience and salary.”
“Generate a heat map for sales across regions.”
ChatGPT will process your data and output a professional-grade visualization, ready for presentations or reports.
ChatGPT’s Advanced Data Analysis feature is a game-changer for anyone working with data. It simplifies tasks like cleaning, analysis, and visualization, making data more accessible and actionable. Whether you’re a small business owner, researcher, or analyst, ChatGPT empowers you to make smarter, data-driven decisions without needing advanced technical expertise.
So why wait? Enable the Advanced Data Analysis feature today and transform your spreadsheets into powerful insights and compelling visualizations with ease.

Dr. Chopra is the founder and editor of thephdcoaches.blogs and Thephdcoaches Learn more about her here and connect with her on Instagram, Facebook and LinkedIn.
Dr. Tripti Chopra, founder of The PhD Coach, is an award-winning mentor and leader in integrating AI into academic research, with over a decade of experience guiding PhD students and researchers. Her work revolutionizes research processes, promotes sustainable writing practices, and inspires scholars to embrace technological advancements.
Copyright© 2023 Thephdcoach All rights reserved.
Leave a Comment