The IMRaD Structure Demystified: Breaking Down Research Papers with AI Tools
The IMRaD format, standing for Introduction, Methods, Results, and Discussion, is the backbone of academic writing in the sciences and beyond. It simplifies the presentation of research findings, creating clarity for readers and researchers alike. But writing such papers can be overwhelming, even for seasoned professionals. Luckily, advancements in AI have made this task more manageable.
This blog will explore the IMRaD paper structure in detail and how AI tools can streamline the research process, from brainstorming to the final draft.
Table of Contents
What is the IMRaD Format?
The Four Key Components of IMRaD
Introduction
Methods
Results
Discussion
AI Tools for Each Section of IMRaD
Abstract: PDF.ai and Yomu AI
Introduction: Paperpal and Yomu AI
Methods: Drumroll.ai, Formula Bot, Julius, SciWheel
Results: Jupyter and React Google Charts
Discussion: Humata and Scispace
How AI Tools Enhance Research Efficiency
Step-by-Step: Writing an IMRaD Paper Using AI Tools
Conclusion: Embracing AI for Smarter Research
1. What is the IMRaD Format?
The IMRaD format is a standardized approach to presenting scientific findings. It structures papers into four clear sections: Introduction, Methods, Results, and Discussion, with an abstract and conclusion often added. Its strength lies in its logical flow, making it easier for readers to follow complex research.
2. The Four Key Components of IMRaD
a) Introduction
This section sets the stage for your research, answering key questions:
What is the context of the study?
Why is the topic important?
What gap in knowledge does it address?
b) Methods
Detail the “how” of your research:
Study design
Participant inclusion/exclusion criteria
Analytical techniques
c) Results
Summarize the data collected during the research. Tables, charts, and statistics shine here to visually present the findings.
d) Discussion
Interpret the results, compare them to previous studies, highlight strengths and weaknesses, and propose future directions for research.
3. AI Tools for Each Section of IMRaD
The IMRaD process, though clear, can be tedious without the right tools. AI platforms have revolutionized research writing. Let’s explore how these tools help at every step.
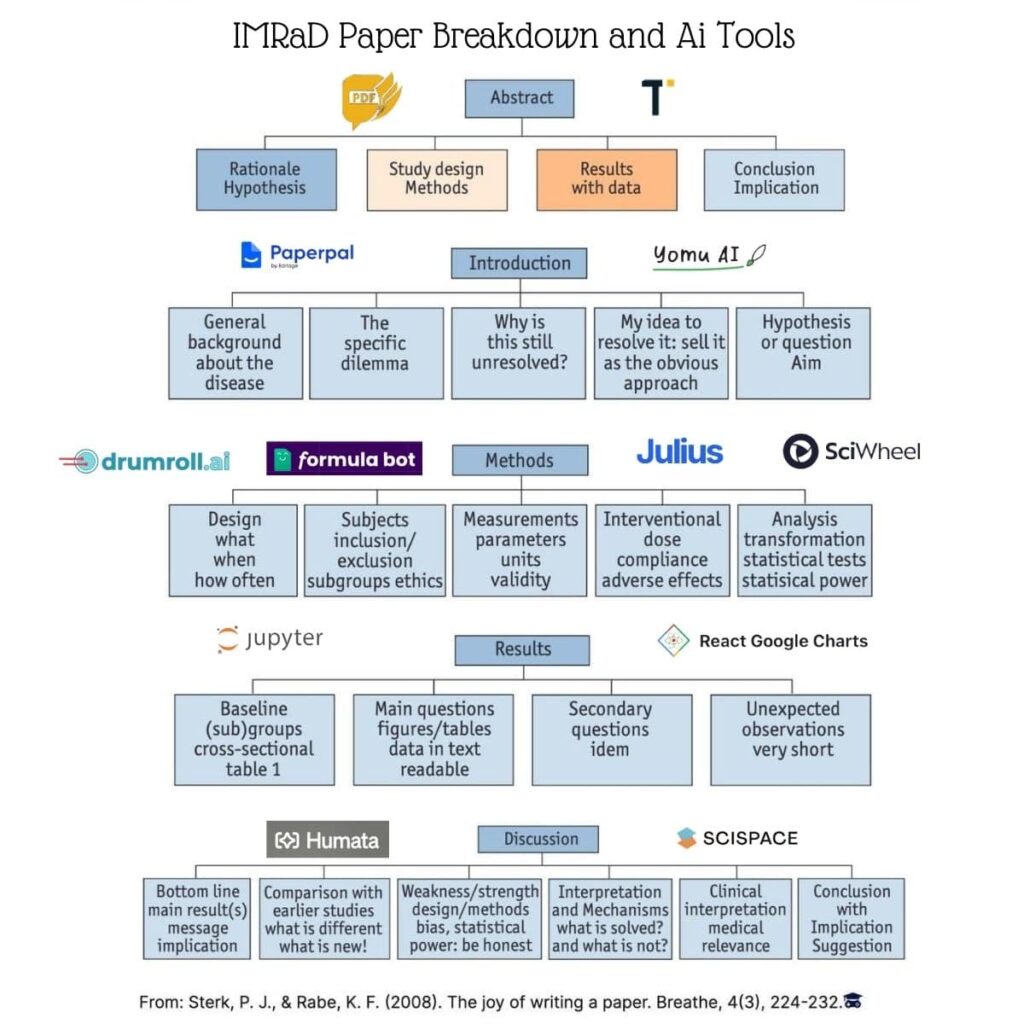
Abstract: PDF.ai and Yomu AI
PDF.ai: Analyze existing research papers to distill ideas for creating an impactful abstract.
Yomu AI: Summarizes core ideas effectively and helps draft concise abstracts tailored to the paper’s content.
Introduction: Paperpal and Yomu AI
Paperpal: Refines your writing by spotting language errors and improving clarity.
Yomu AI: Assists in drafting background information, contextualizing the research gap, and defining the hypothesis.
Methods: Drumroll.ai, Formula Bot, Julius, and SciWheel
Drumroll.ai: Streamlines the design of experiments, ensuring the methodology is logically sound.
Formula Bot: Automates calculations and generates accurate formulae for statistical analyses.
Julius: Facilitates collaborative research documentation.
SciWheel: Manages citations and provides templates for structured reporting.
Results: Jupyter and React Google Charts
Jupyter: Enables data visualization and interactive computation for presenting findings effectively.
React Google Charts: Creates intuitive graphs and tables, making data more accessible to readers.
Discussion: Humata and Scispace
Humata: Summarizes findings, highlights study implications, and integrates contextual insights from related literature.
Scispace: Helps in critically evaluating study limitations and framing future directions with precision.
4. How AI Tools Enhance Research Efficiency
Time-Saving
AI automates tedious tasks like data analysis, formatting, and editing, saving hours of manual work.
Improved Accuracy
From ensuring statistical correctness to maintaining linguistic clarity, AI minimizes errors.
Enhanced Collaboration
Platforms like Julius and SciWheel foster collaboration among researchers, streamlining workflow.
Better Insights
Tools like Humata and PDF.ai extract meaningful insights from vast datasets, enabling informed decision-making.
5. Step-by-Step: Writing an IMRaD Paper Using AI Tools
Step 1: Begin with the Abstract
Use PDF.ai to identify key highlights of the study.
Summarize findings with Yomu AI.
Step 2: Develop the Introduction
Draft an engaging background with Paperpal.
Clarify the research question and hypothesis with Yomu AI.
Step 3: Structure the Methods Section
Utilize Drumroll.ai to design experiments.
Perform calculations and validate data using Formula Bot.
Leverage Julius for team-based inputs.
Step 4: Present Results Visually
Analyze and plot data interactively with Jupyter.
Create visually engaging charts using React Google Charts.
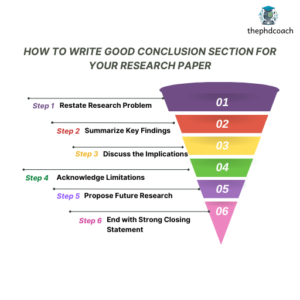
Step 5: Write the Discussion
Use Humata to summarize key findings and implications.
Critically evaluate the research’s strengths and weaknesses with Scispace.
6. Conclusion: Embracing AI for Smarter Research
The IMRaD format remains the gold standard for scientific communication. But as research becomes more complex, AI tools offer an essential lifeline. Whether it’s summarizing previous work, automating calculations, or visualizing data, these tools empower researchers to focus on innovation rather than administrative tasks.
FAQs
What does IMRaD stand for? IMRaD stands for Introduction, Methods, Results, and Discussion. It is a widely used structure in academic writing.
How can AI tools improve research writing? AI tools save time, enhance accuracy, and streamline the research process, allowing researchers to focus on critical thinking.
Are AI tools reliable for scientific writing? Yes, modern AI tools are highly reliable and can improve precision, though human oversight is still necessary.
Can I use these AI tools for free? Many AI tools offer free versions with limited functionality, while premium features are available at a cost.
Which AI tool is best for data visualization? Jupyter and React Google Charts are excellent for creating interactive and intuitive visual representations of data.


Leave a Comment